Reading your results
The dashboard is your home screen after you upload or select a sample. You may arrive while annotation is still running; results fill in as the background annotation job completes.
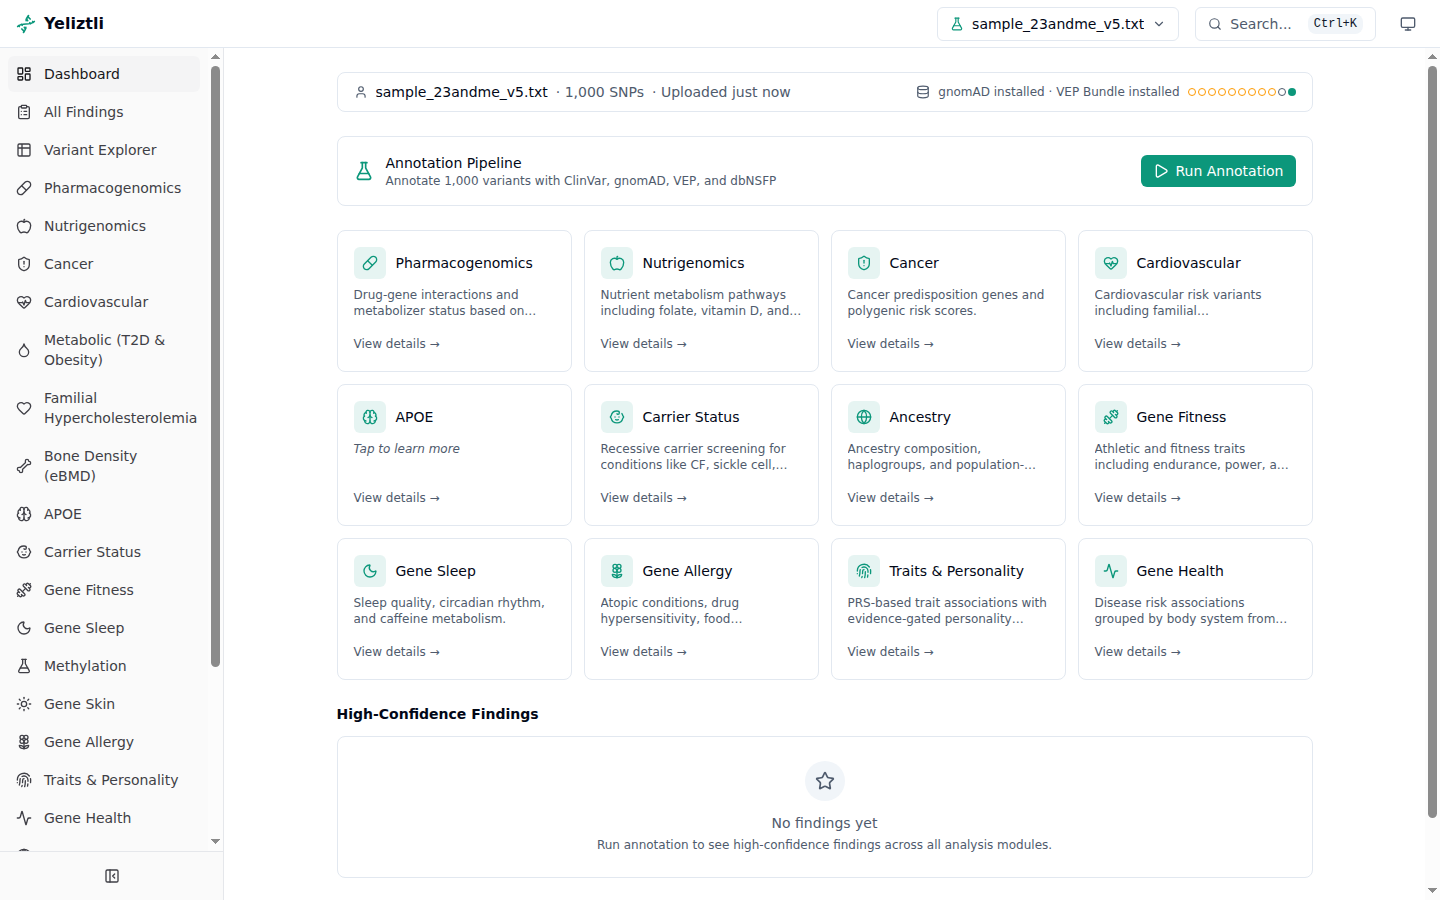
The dashboard
- Status bar (top) — the current sample, annotation status, and reference-database versions. Those versions are the reference-data snapshot your findings were computed against; updating databases later doesn't refresh existing results until you re-annotate — see how updates affect your results.
- Annotation Pipeline panel — live annotation progress, an ETA, and a Cancel annotation button while a job is running. After a finished, failed, or cancelled job is dismissed, the same panel shows Run Annotation so you can annotate or re-annotate the selected sample.
- Module cards — a grid linking to each analysis module, with finding counts.
- High-confidence findings — the strongest findings across all modules.
- QC summary — a collapsible panel of sample-quality metrics (heterozygosity, call rate,
per-chromosome counts). The headline sample count shown in the status bar, annotation panel,
and Total Variants metric is the total number of genotyped positions in the uploaded file,
including positions that were not called (no-calls). Call rate uses that same total as its
denominator (
called / total), so the count is larger than the number of actually called positions. It can also differ from the Variant Explorer's default count, because the table initially hides rows with missing annotation state; use Show unannotated there when you want to include those rows. The heterozygosity check's z-score compares this sample's heterozygosity rate against your own other uploaded samples on the same genotyping array — not a population or array-wide baseline. Heterozygosity is strongly array-dependent (SNP arrays overestimate it by design, so the same person's rate isn't comparable across different arrays), so the comparison is only valid within one array type. It needs at least three same-array samples to compute; with fewer it is withheld (shown as "Not enough samples" or "No comparable array peers") rather than guessed. Because the reference is your own small set of uploads, a z-score built from as few as three samples can swing widely and does not mean "unusual for this chip in the general population."
Use the sample selector in the top navigation to switch between uploaded samples; each has its own isolated results.
Findings and evidence ratings
Findings-producing analysis modules emit findings, and each finding carries an evidence rating (★ to ★★★★) so you can tell well-established results from speculative ones at a glance:
| Rating | Roughly means |
|---|---|
| ★★★★ | Strong clinical evidence — e.g. ClinVar Pathogenic/Likely-Pathogenic (reviewed), CPIC Level A, or genome-wide-significant GWAS with a very large effect size. |
| ★★★ | Good evidence — e.g. ClinVar Pathogenic/Likely-Pathogenic (single submitter), CPIC Level B, or replicated, genome-wide-significant GWAS. |
| ★★ | Moderate — e.g. a variant of uncertain significance with functional support, or a single genome-wide-significant GWAS association without independent replication. |
| ★ | Weak/preliminary or discovery context — e.g. a single study, candidate-gene association, or carried rare/novel variant without stronger clinical evidence. |
For GWAS findings, genome-wide significance addresses multiple testing, but Yeliztli does not treat a single significant association as definitive. Higher GWAS tiers require genome-wide significance plus independent replication, or genome-wide significance plus a very large effect size under Yeliztli's tiering rule. The cited GWAS papers support the p-value, replication, and false-positive-control rationale [1,2].
The module reference explains what each module reports and how to interpret it. Some modules (wellness/trait scores) are intentionally capped at lower ratings, and some report categorical levels rather than numeric risk.
Some sidebar pages depend on optional operator provisioning. For example, HLA (imputed) stays empty until HIBAG and ancestry-specific HLA model files are configured and run for that sample.
Some ClinVar records are intentionally withheld from findings. Variants marked Conflicting classifications of pathogenicity are not shown as definitive findings; see ClinVar classifications that conflict and review them in the Variant Explorer.
The Findings Explorer
Beyond the per-module pages, the Findings Explorer lets you filter findings across every module at once by module and minimum evidence rating. Each finding links back to its source module when that module has a dedicated page, and gene symbols or variant IDs link to their detail pages when available, including Gene Detail pages for individual genes. Modules that do not have their own dashboard page still surface their findings here.
After a full annotation run, the total finding count may be dominated by Rare Variant Finder rows. A typical sample can have tens of thousands of carried rare or gnomAD-AF-missing variants, usually at ★. Those discovery-context ★ rows are an inventory for review, not diagnoses and not known disease associations. ClinVar pathogenic and lower-penetrance/risk-allele rows are labelled separately. Use the module, category, and minimum-evidence filters to narrow the list.
Sensitive results are opt-in
A few modules are disclosure-gated: their results stay hidden until you explicitly acknowledge what you're about to see (for example APOE and Alzheimer's-risk-related findings). You're always in control of when those are revealed.
Findings are a starting point, not a diagnosis
Treat every finding as provisional. Consumer array data produces false positives, especially for rare variants — see Intended use & disclaimers. Confirm anything health-related with a clinician and an accredited lab.
Going deeper
From here you can dig into individual variants in the Variant Explorer, inspect genes in Gene Detail, visualise variants in the Genome Browser, build custom queries, and generate PDF reports.
References
[1] Barsh GS, Copenhaver GP, Gibson G, Williams SM. Guidelines for Genome-Wide Association Studies. PLOS Genetics. 2012;8(7):e1002812.
[2] Chen Z, Boehnke M, Wen X, Mukherjee B. Revisiting the genome-wide significance threshold for common variant GWAS. G3: Genes, Genomes, Genetics. 2021;11(2):jkaa056.